Page Speed Optimization
Page Speed Optimization for Your Website
Our page speed optimization work improves Core Web Vitals, load times, and Lighthouse scores so your site earns stronger rankings, higher conversions, and fewer visitors who bounce before the page paints.
- Businesses served
- 50+
- Projects delivered
- 150+
- Google rating
- 5★
Sites we built
Google search clicks, before and after
- Colfax GlassWindows and glass+408%265 → 1,346
- Rocklin Gutter GuardGutter guards and gutter cleaning+401%173 → 866
- NorCal EarthworksDemolition, excavation and land clearing+1,196%25 → 324
Search Console, Jun 18–Sep 15, 2026 vs. Mar 20–Jun 17, 2026.
See the workSpeed Is Not Optional—It Is Your Competitive Advantage
Website performance directly impacts revenue, SEO rankings, and user satisfaction. Fast sites convert better, rank higher, and keep users engaged.
Conversion Impact
Slow pages lose visitors before they ever see your offer. Speed work keeps more of the traffic you already have.
SEO Rankings
Google uses Core Web Vitals as official ranking signals. Fast sites rank higher, earn more organic traffic, and gain competitive SEO advantage in crowded markets.
Core Web Vitals Mastery
We specialize in optimizing the metrics Google actually uses for rankings: Largest Contentful Paint (LCP), Interaction to Next Paint (INP), and Cumulative Layout Shift (CLS). These metrics measure real user experience and directly impact both SEO rankings and conversion rates. Our optimization process targets the 75th percentile of real-world users—the threshold Google uses for evaluation.

Conversion-Focused Speed Optimization
Speed is not just a technical metric—it is a conversion driver. We approach performance optimization as revenue optimization, prioritizing fixes that improve conversion rates and revenue. Our data-driven methodology focuses on the pages and user journeys that matter most to your business goals.

Advanced Image & Asset Optimization
Images are often the largest part of a page’s weight and the single biggest performance opportunity. We implement comprehensive image optimization strategies using next-generation formats, responsive delivery, lazy loading, and CDN distribution. Asset optimization extends to JavaScript, CSS, fonts, and third-party scripts—ensuring every byte is justified and efficiently delivered.

Technical SEO Performance Enhancement
Page speed is a confirmed Google ranking factor and foundational to technical SEO excellence. Fast sites earn better rankings, lower bounce rates, more page views, and higher domain authority. We optimize with SEO in both mind and practice—ensuring your speed improvements translate to visibility improvements. Our work directly supports your organic growth strategy.

Google Search Console
Fast Sites That Earn Their Search Traffic
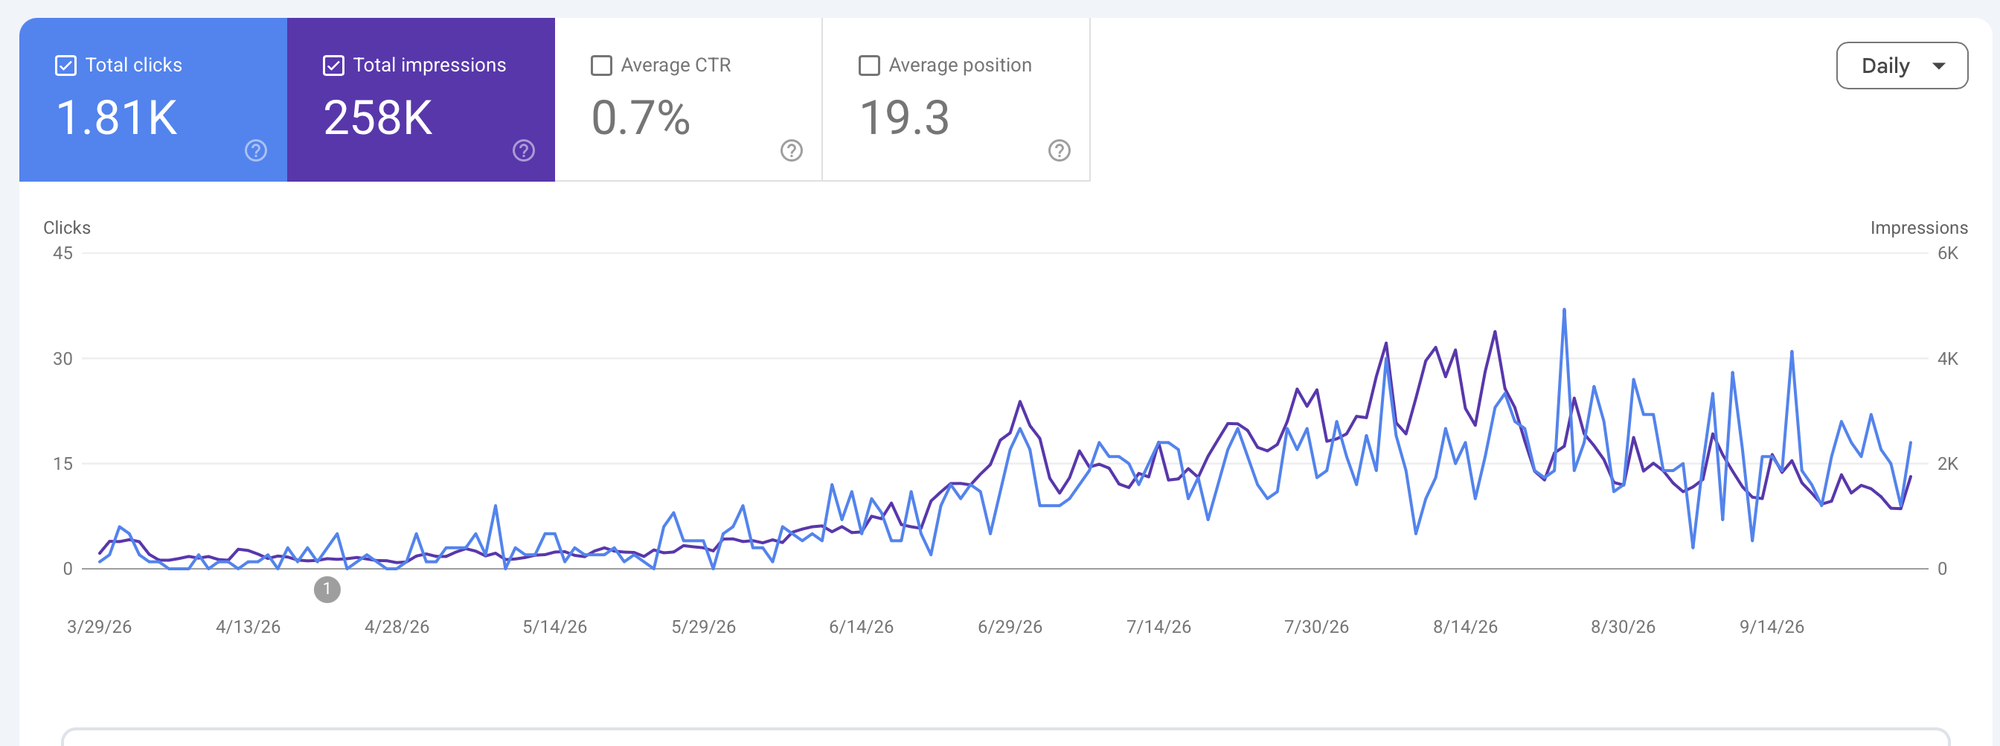
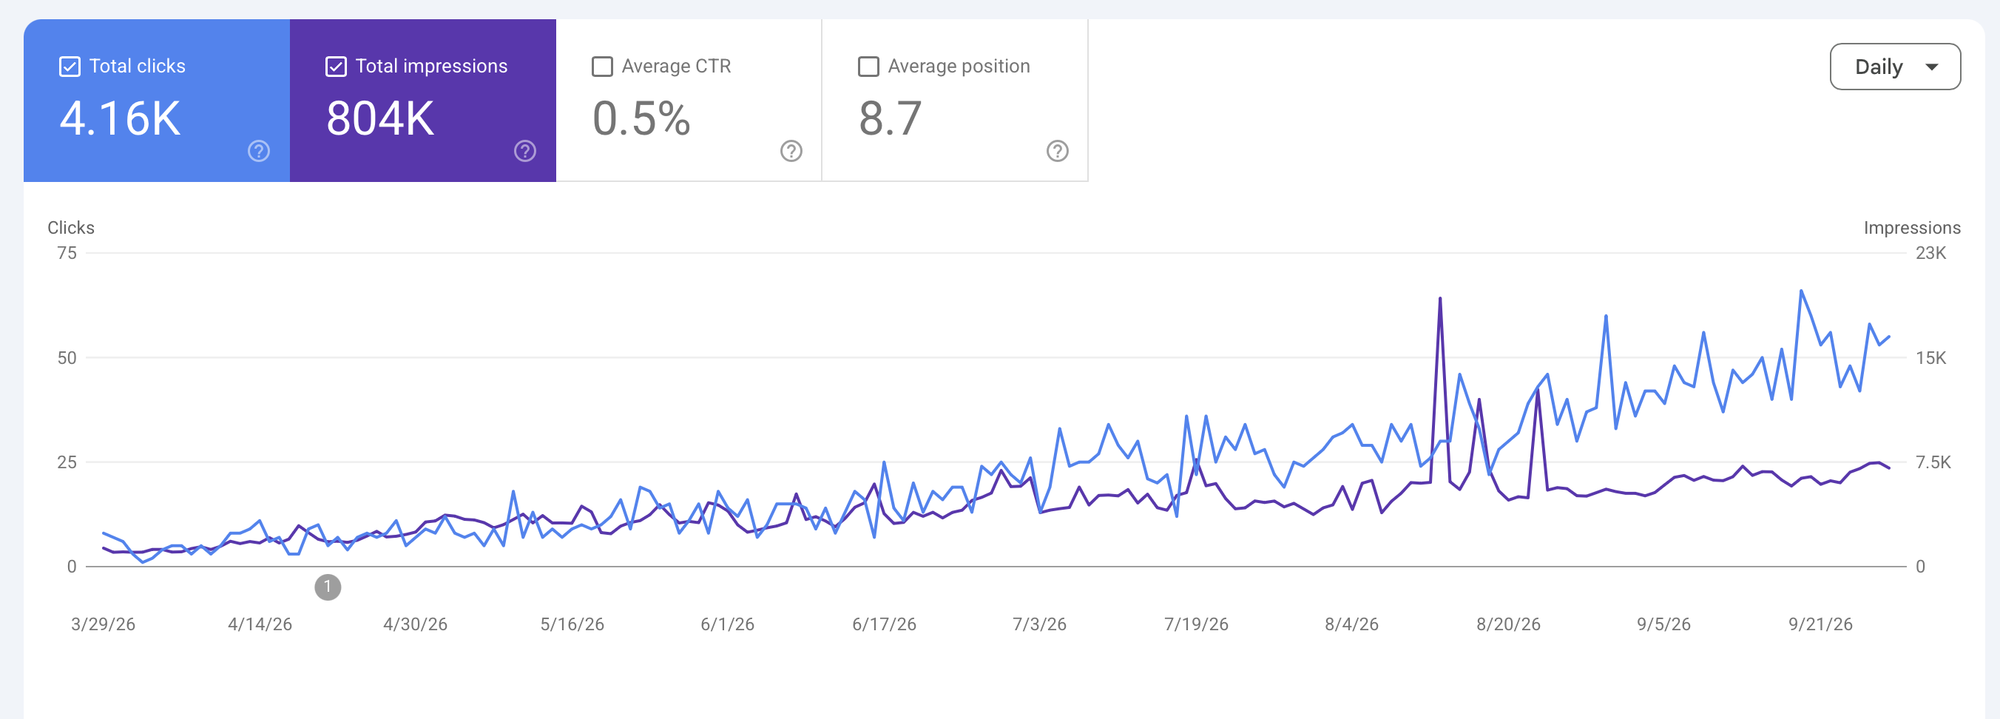
Every Verlua build is a custom Next.js site made to load quickly. These Google Search Console reports show the search traffic those sites earn. They report clicks, not page speed scores.
 (opens the full-size screenshot)
Window and glass contractor, Placer County
45 → 450Google clicks: first 4 weeks vs. last 4 weeks of the chart
1,811 clicks · 257,832 impressions · Mar 29 – Sep 28, 2026
Read the Colfax Glass case study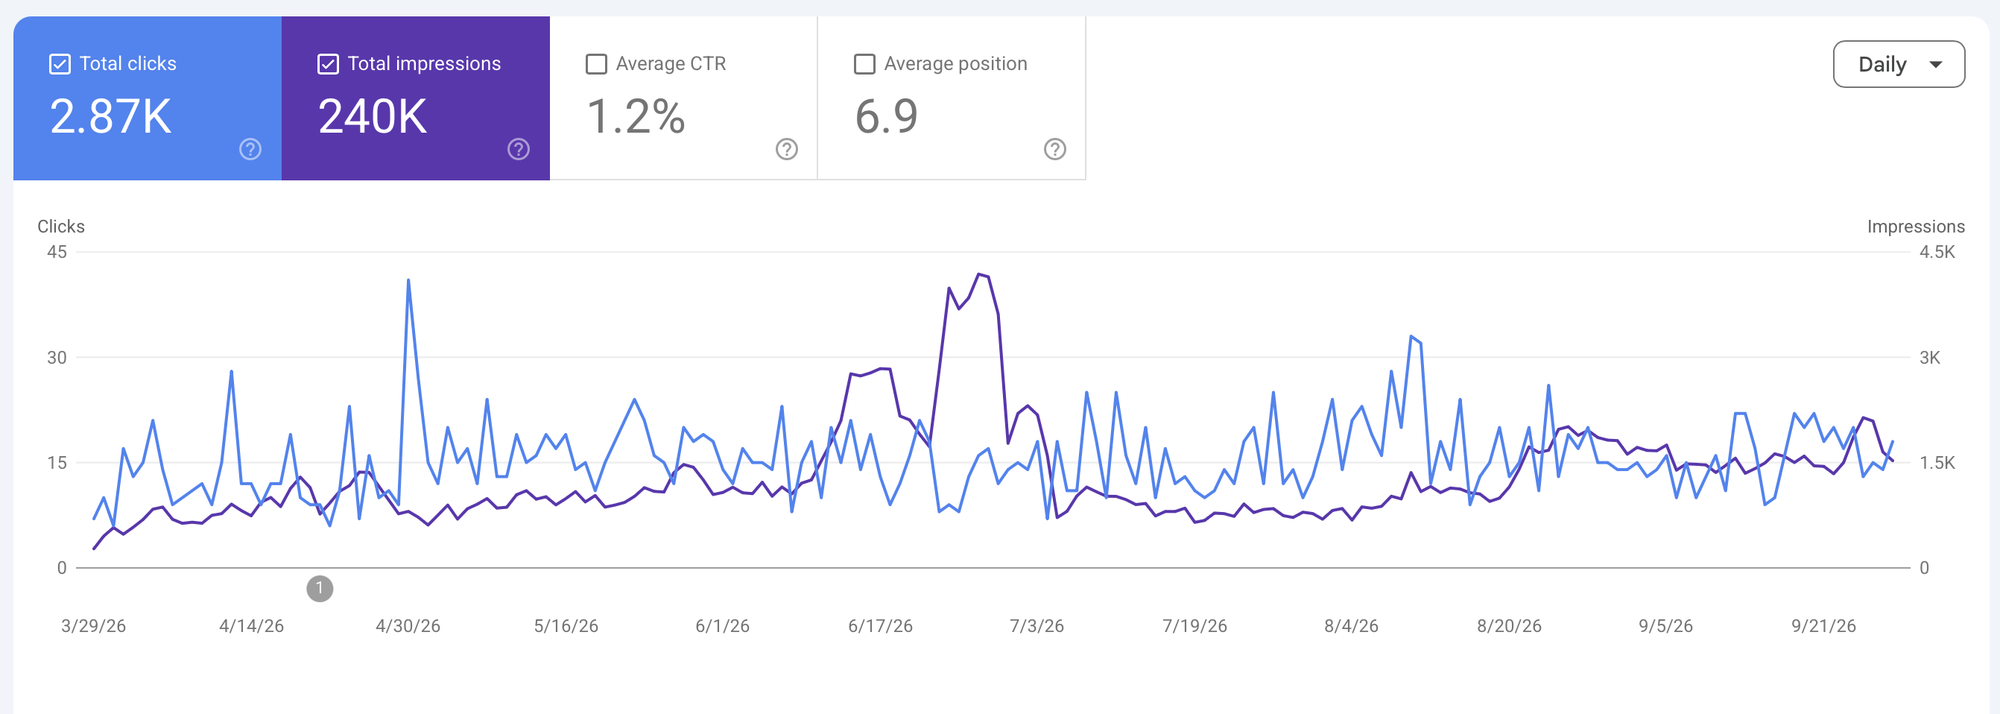 (opens the full-size screenshot)
Sacramento barbershop, three locations
~15 a dayGoogle clicks, steady for six months
2,868 clicks · 240,375 impressions · Mar 29 – Sep 28, 2026
 (opens the full-size screenshot)
Raw honey producer and online store, Northern California
162 → 1,328Google clicks: first 4 weeks vs. last 4 weeks of the chart
4,160 clicks · 803,922 impressions · Mar 29 – Sep 28, 2026
Read the NorCal Nectar case studyBlue line: clicks, people who came to the site from GooglePurple line: impressions, times the site showed up in results
Screenshots from Google Search Console (Performance report, web search), captured September 30, 2026. Search traffic only, not lead or sales counts. Select any chart to open it full size.
Our Performance Optimization Process
A systematic, data-driven approach that delivers measurable speed improvements and business results
Comprehensive Performance Audit
We conduct deep technical analysis using industry-standard tools: Google PageSpeed Insights, Lighthouse, WebPageTest, Chrome DevTools, and Real User Monitoring data. We analyze both lab data (controlled testing) and field data (real user experiences) to identify bottlenecks, measure current performance, and establish baseline metrics.
Deliverables
Optimization Strategy & Roadmap
Based on audit findings, we develop a prioritized optimization roadmap targeting the highest-impact improvements first. We define performance budgets, set Core Web Vitals targets, and map optimizations to business goals. Strategy accounts for your technology stack, resources, and business priorities.
Deliverables
Front-End Optimization Implementation
We optimize front-end assets and rendering: compress and convert images to next-gen formats, minify and bundle JavaScript and CSS, implement code splitting and lazy loading, optimize font loading, reduce render-blocking resources, and implement critical CSS for above-the-fold content.
Deliverables
Backend & Infrastructure Optimization
We optimize server-side performance and infrastructure: improve server response times (TTFB), implement advanced caching strategies, configure CDN for global asset delivery, optimize database queries, enable compression (Gzip/Brotli), and implement HTTP/2 or HTTP/3 for faster protocol communication.
Deliverables
Testing, Validation & Refinement
We rigorously test all optimizations across devices, browsers, and network conditions. We validate Core Web Vitals improvements using real-world data, conduct A/B tests to measure conversion impact, fix any regressions or compatibility issues, and fine-tune performance for optimal results.
Deliverables
Monitoring, Documentation & Support
We set up continuous performance monitoring with alerts for regressions, provide comprehensive documentation of optimizations and best practices, deliver training for your team on maintaining performance, and establish performance budgets for future development. Ongoing support ensures sustained speed.
Deliverables
Complete Performance Optimization Deliverables
Everything you need for sustained speed, better rankings, and higher conversions
Performance Audit Report
Comprehensive analysis of current performance using Lighthouse, PageSpeed Insights, WebPageTest, and Real User Monitoring data with identified bottlenecks and opportunities.
Optimization Roadmap
Prioritized action plan with specific optimizations mapped to expected impact, timeline, and resource requirements for your approval and tracking.
Optimized Assets
All images compressed and converted to next-gen formats (WebP/AVIF), JavaScript and CSS minified and bundled, fonts optimized, and third-party scripts reviewed.
Server & CDN Configuration
Server response time (TTFB) optimizations, caching strategies implemented, CDN configured for global delivery, and compression enabled for all assets.
Core Web Vitals Improvements
LCP, INP, and CLS optimized to meet or exceed Google thresholds with documented before-and-after metrics and ongoing monitoring recommendations.
Code Optimization
Critical CSS extraction, render-blocking resource elimination, code splitting implementation, lazy loading configuration, and async script loading.
Performance Monitoring Setup
Real User Monitoring (RUM) configured, Core Web Vitals tracking enabled, performance dashboards created, and alerting configured for regressions.
Documentation & Training
Complete documentation of optimizations performed, performance best practices guide, performance budget recommendations, and team training for maintaining speed.
Cross-Device Testing Report
Validation of performance improvements across desktop, mobile, and tablet devices on multiple browsers and network conditions with detailed results.
Complete Performance & Growth Stack
Combine speed optimization with these services for maximum impact
Conversion Rate Optimization
Speed improvements boost conversions, but CRO testing multiplies those gains further.
Keyword Research
Discover the right keywords to target once your fast site is ready to compete in rankings.
Analytics & Tracking Setup
Track Core Web Vitals and user behavior to measure the impact of speed improvements.
SEO for E-Commerce
E-commerce sites need exceptional speed. Combine technical optimization with e-commerce SEO.
Custom Web Development
Build blazing-fast sites from the ground up with modern performance-first frameworks.
Website Design
Beautiful, conversion-optimized designs that load instantly and delight users.
Frequently Asked Questions
Everything you need to know about page speed and performance optimization
What are Core Web Vitals and why do they matter?
Core Web Vitals are Google's metrics for real-world user experience: Largest Contentful Paint (LCP) measures loading, Interaction to Next Paint (INP) measures responsiveness, and Cumulative Layout Shift (CLS) measures visual stability. Google uses them as part of its page experience signals, and they describe what a visitor actually feels when the page loads. Google's guidance (web.dev/vitals) is LCP within 2.5 seconds, INP of 200 milliseconds or less, and CLS of 0.1 or less.
How much does page speed really affect conversions and revenue?
Slow pages lose visitors. Mobile users on cellular connections are the least patient, and a page that stalls on a phone often gets abandoned before it finishes loading. We do not promise a specific conversion lift, because it depends on your site, your traffic, and where the slowdowns are. We measure your load times first, fix the biggest bottlenecks, and re-test so you can see the change.
What causes slow website performance?
Common performance bottlenecks include unoptimized images (often the biggest culprit), render-blocking JavaScript and CSS, lack of browser caching, slow server response times, excessive third-party scripts (analytics, ads, chat widgets), unminified code, no content delivery network (CDN), inefficient database queries, heavy fonts, and poorly optimized JavaScript frameworks. We conduct thorough audits using real-world data to identify your specific bottlenecks and prioritize fixes by impact.
How long does performance optimization take?
Quick wins like image compression, browser caching, and minification can often ship in the first week or two. Deeper work on front-end code, the server, and infrastructure takes longer, and complex sites with legacy code take the longest. We start with an audit and a prioritized roadmap, then implement changes in priority order so you can see measurable improvements after the first round.
Will performance optimization affect my site design or functionality?
No—proper performance optimization improves technical implementation without changing design or functionality. We optimize how assets load, not what they look like. In fact, we often enhance user experience through techniques like lazy loading, progressive image loading, and skeleton screens that make the site feel faster. All changes are thoroughly tested across browsers and devices to ensure nothing breaks. You keep your design and features while gaining speed.
How do you optimize images without losing quality?
We use layered image optimization: next-gen formats (WebP, AVIF) with fallbacks for older browsers, responsive images sized to the screen, visually lossless compression, lazy loading for images below the fold, proper sizing to avoid browser scaling, and CDN delivery. Most images can be made much smaller with no visible quality loss.
What is a good Google PageSpeed Insights score?
PageSpeed Insights rates scores 90-100 as good, 50-89 as needs improvement, and 0-49 as poor. Scores are only indicators. What matters are the underlying Core Web Vitals and real-world experience. We aim for green scores when feasible and prioritize the metrics that affect search and conversions: LCP within 2.5 seconds, INP of 200 milliseconds or less, and CLS of 0.1 or less. Some complex applications score lower while still performing well for real visitors.
Does page speed really affect SEO rankings?
Yes. Google has used page speed as a ranking factor for desktop since 2010 and for mobile since 2018, and Core Web Vitals are part of its page experience signals. Speed is one signal among many, and relevance still matters most. Beyond ranking, fast pages keep visitors from leaving, which helps every other part of your marketing.
What is the difference between lab data and field data?
Lab data (Lighthouse, PageSpeed Insights lab results) measures performance in controlled conditions on a simulated mid-tier device and connection—useful for debugging and development. Field data (Chrome User Experience Report, Real User Monitoring) measures actual user experiences across real devices, connections, and locations—this is what Google uses for rankings and what affects your conversions. We optimize for both: lab data guides our development work, while field data validates real-world impact and informs priorities.
How do you maintain performance after the initial optimization?
We establish performance budgets (maximum sizes for JavaScript, CSS, images), integrate performance monitoring into your workflow (automated testing in CI/CD), set up Real User Monitoring to track Core Web Vitals over time, provide team training on performance best practices, document optimization guidelines for future development, schedule quarterly performance reviews to catch regressions, and offer ongoing optimization retainers. Performance is not one-and-done—it requires continuous attention as sites evolve.
Ready to Accelerate Your Website and Revenue?
Let's optimize your site speed, improve Core Web Vitals, boost conversions, and climb search rankings with expert performance engineering.